
Over the past few months, nonprofits and funders alike have been trying to understand the impact of a potential loss of government grants. In our previous analysis, we’ve found private foundations would have to increase their grantmaking by 282% to address the potential $303 billion gap left by government grantmaking. Additionally, Urban Institute’s data tool estimates that two-thirds of nonprofits receiving government grants would face deficits if these grants disappeared.
But how rapidly would these cuts to government grants impact nonprofits’ ability to continue their work? And what’s the potential impact on nonprofit employees? Our new analysis and Tableau Public dashboard provide some answers.
A new dashboard for understanding nonprofits’ cash runway
To estimate how long nonprofits can survive without government grants, we calculated their “cash runway.” Cash runway estimates how many months a nonprofit receiving government grants could continue operating if those grants stopped but everything else (i.e., expenses and other income) stayed the same.i We also calculated how many people work at these nonprofits and therefore could be at risk of losing their jobs.
Here are some key findings from the data:
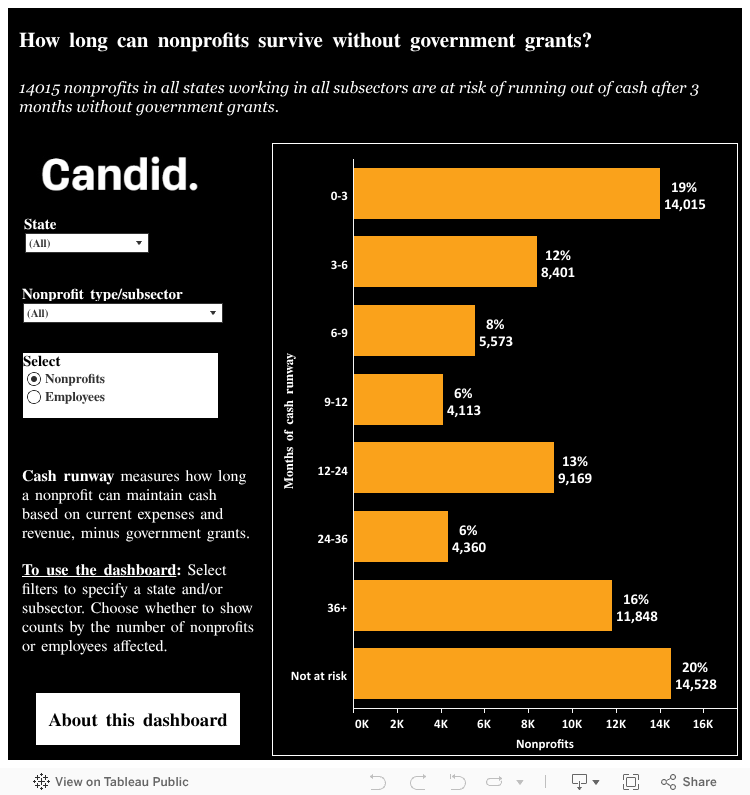
Nearly one in five government grantees would run out of cash in three months
var divElement = document.getElementById(‘viz1746108386467’); var vizElement = divElement.getElementsByTagName(‘object’)[0]; if ( divElement.offsetWidth > 800 ) { vizElement.style.width=’750px’;vizElement.style.height=’795px’;} else if ( divElement.offsetWidth > 500 ) { vizElement.style.width=’750px’;vizElement.style.height=’795px’;} else { vizElement.style.width=’100%’;vizElement.style.height=’977px’;} var scriptElement = document.createElement(‘script’); scriptElement.src = ‘https://public.tableau.com/javascripts/api/viz_v1.js’; vizElement.parentNode.insertBefore(scriptElement, vizElement);
This view of the dashboard shows the number of nonprofits receiving government grants, across all states and nonprofit types. Feel free to adjust the filters here to customize your view, or explore the complete dashboard on Tableau Public.
Our analysis reveals how rapidly a halt in government grants would affect nonprofits across the country. About 19% of nonprofits receiving government grants—more than 14,000 organizations—maintain a cash runway of just three months or less, after which they would completely run out of cash. By the six-month mark, this grows to about 31% of all government grantees—or over 22,400 organizations. Some organizations show potential for greater resilience, with about 16% (11,800 nonprofits) able to sustain operations for three years or more without government grants.
It’s also worth noting that approximately 20% of government grantees would remain financially stable regardless of funding cuts, as revenue not from government grants (e.g., program service fees or contributions from individuals or foundations) fully covers their expenses. These findings highlight both the immediate vulnerability and varied financial positions across the sector.
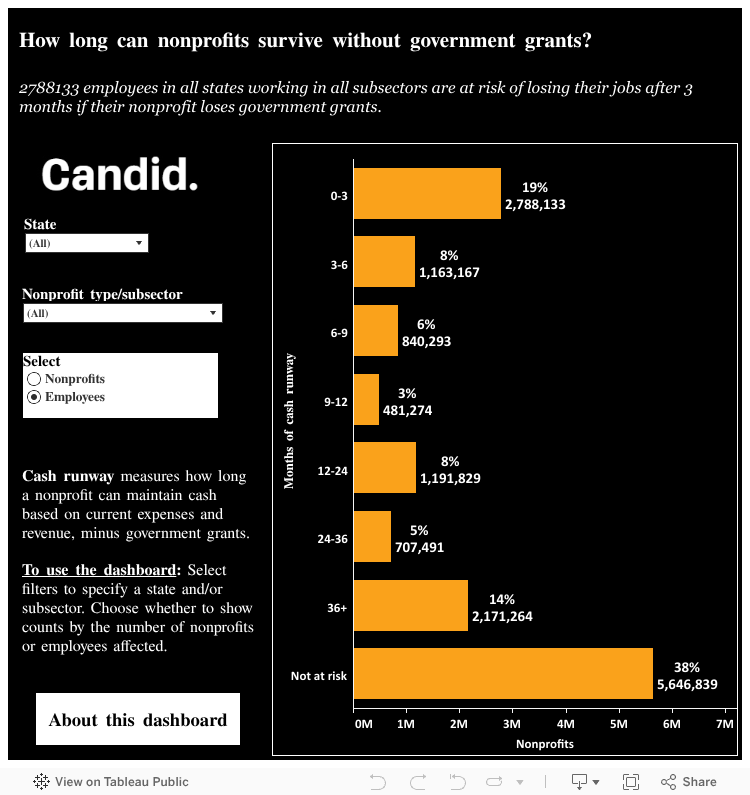
Nearly 2.8 million jobs would be at risk within the first three months
var divElement = document.getElementById(‘viz1746108424083’); var vizElement = divElement.getElementsByTagName(‘object’)[0]; if ( divElement.offsetWidth > 800 ) { vizElement.style.width=’750px’;vizElement.style.height=’795px’;} else if ( divElement.offsetWidth > 500 ) { vizElement.style.width=’750px’;vizElement.style.height=’795px’;} else { vizElement.style.width=’100%’;vizElement.style.height=’977px’;} var scriptElement = document.createElement(‘script’); scriptElement.src = ‘https://public.tableau.com/javascripts/api/viz_v1.js’; vizElement.parentNode.insertBefore(scriptElement, vizElement);
This view of the dashboard shows the number of employees of nonprofits receiving government grants, across all states and nonprofit types. Feel free to adjust the filters here to customize your view, or explore the complete dashboard on Tableau Public.
The impact of cuts to government grants extends well beyond the organizations themselves—it affects millions of nonprofit employees nationwide. Our analysis shows that almost 2.8 million people work at nonprofits that would run out of cash within just three months of losing all government grants. Nearly four million people work at organizations with a cash runway of six months or less, and approximately 5.3 million work at those with a cash runway of under one year.
While many nonprofits may show resilience—about 5.6 million employees work at nonprofits that would remain financially stable—the potential for rapid job loss is significant. These figures highlight how quickly funding disruptions could ripple through communities across the country, affecting not just nonprofit services but also local economies.
Impact varies by state and nonprofit type

var divElement = document.getElementById(‘viz1746108454084’); var vizElement = divElement.getElementsByTagName(‘object’)[0]; if ( divElement.offsetWidth > 800 ) { vizElement.style.width=’750px’;vizElement.style.height=’795px’;} else if ( divElement.offsetWidth > 500 ) { vizElement.style.width=’750px’;vizElement.style.height=’795px’;} else { vizElement.style.width=’100%’;vizElement.style.height=’977px’;} var scriptElement = document.createElement(‘script’); scriptElement.src = ‘https://public.tableau.com/javascripts/api/viz_v1.js’; vizElement.parentNode.insertBefore(scriptElement, vizElement);
This view of the dashboard is filtered to employees that work at human services nonprofits that receive government grants and that are located in New York State. Feel free to adjust the filters here to customize your view, or explore the complete dashboard on Tableau Public.
The vulnerability of nonprofits to government grantmaking disruptions varies based on where they operate and what services they provide. To better understand the cash runway for nonprofits across the sector, users can filter the data for specific states or nonprofit types.
For example, narrowing the data to mental health and crisis intervention organizations reveals that 28% of these critical service providers would run out of cash within three months if government funding stopped. Similarly, geographic filtering exposes regional vulnerabilities; in New York, for example, over 91,000 people work at human services nonprofits with a cash runway of three months. With these filtering options, users can navigate between an overview of how government grantees and their employees could be affected.
By understanding which organizations face the greatest immediate risk to their “cash runway,” funders, policy makers, and nonprofit leaders can prioritize support and develop backup plans before reaching critical financial breaking points. We invite you to explore the dashboard, look at the patterns most relevant to your work, and consider how these insights might help build more resilient funding models and advocacy strategies in the months ahead.
i Cash runway is calculated by dividing an organization’s total cash and cash equivalents by its average monthly deficit after removing government grant revenue.
Formula: (Cash + Cash Equivalents) / ((Total Expenses – (Total Revenue – Government Grants)) / 12). Nonprofits that have a negative number in the denominator are deemed to be “not at risk”—i.e., their revenue exceeds their expenses. It is worth noting that this metric doesn’t account for how a nonprofit might adapt in a crisis—such as cutting expenses, tapping into other assets, or raising emergency funds. It also may include cash that was received under a specific grant, meaning not all of it may be available to cover a funding gap. Despite these limitations, cash runway offers a clear timeline that’s easy to compare across organizations.
The post How long can nonprofits survive without government grants? appeared first on Candid insights.